
What is a Sprint Burndown Chart?
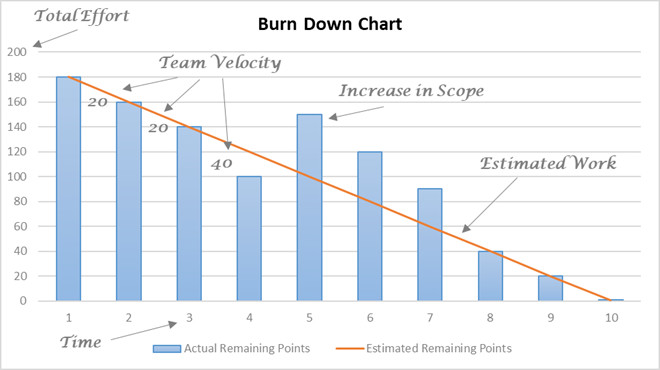
In the Scrum method, the sprint burndown chart shows how much work has been accomplished in a sprint and the remaining effort required. It helps the team measure their performance against a benchmark. Each day is assigned an ideal effort and an actual effort, which is the actual amount of work remaining. The more tasks that are completed, the higher the real effort will go.
The bottom of the chart shows how many tasks exist or completed. The burndown chart gives team members a sense of what they have achieved and what remains to be done in the sprint. The sprint burndown chart is maintained throughout a sprint as progress is made, to see whether or not the team is meeting its goals on time and on budget.
Benefits of Using The Sprint Burndown Chart
It can help teams collaborate on tasks. It allows them to evaluate effort, estimate time, and break down tasks into smaller pieces. It also helps them avoid risks, such as scope creep, by visually depicting the remaining time and effort. This helps team members anticipate what is ahead and avoid delays. This is an effective communication tool, which can be printed out for stakeholders to review.
The burndown chart can be a useful tool when determining whether a team is on track to complete its sprint goals. It shows how much work is still needed to complete each Story Point or Product Increment. It also shows how much time remains to complete the Sprint goals. If the team maintains its current velocity, it will achieve its target before the sprint ends.
The sprint burndown chart helps the team visualise how much work remains for each task. It shows the time required to complete a task and is an excellent way to keep track of progress. By making work visible, it makes the Product Owner and Scrum Master‘s job easier. It also reduces the risk of errors.
A sprint burndown chart allows teams to measure their progress against the Customer User Stories and determine how much effort they have completed. The chart reflects the remaining work and the time since the beginning of the Sprint.
How to Use A Sprint Burndown Chart
The team should assess work required to complete each task at the beginning of the iteration. This should result in a line that stretches across the graph, which indicates good work pace. Ideally, the slope of the graph will move downwards each day, and the graph should reach the end of the x-axis by the end of the Sprint.
To use a sprint burndown chart, choose a few tasks and User Stories that you want to complete in the sprint. Then, analyse each task to determine its priority and estimate how long it will take to complete it. Add up all of these estimates and you will have your Effort Remaining.
The sprint burndown chart should be updated daily to ensure that the team is on track to complete their Sprint goal. If the chart trends above the ideal work line, too much work remains to be completed. This trend may be hard to detect, but it can help identify issues. If the chart is too high, it may be a sign that the team is drifting towards a failure of the Sprint.
IT Management & Consulting International
IT Management & Consulting mission is to help businesses and organisations based in Stockholm improve productivity through Agile and Scrum leadership.
We have previously worked with a range of renowned companies, including Goldman Sachs, H&M Group, Cold Technology, and Clebag. Over the past seven years, we have helped clients reduce developing costs by up to 20% and improve on-time delivery by up to 65%.
We are always open to working with companies in Stockholm who are looking to increase their productivity.Contact us today for a free consultation. We look forward to hearing from you.